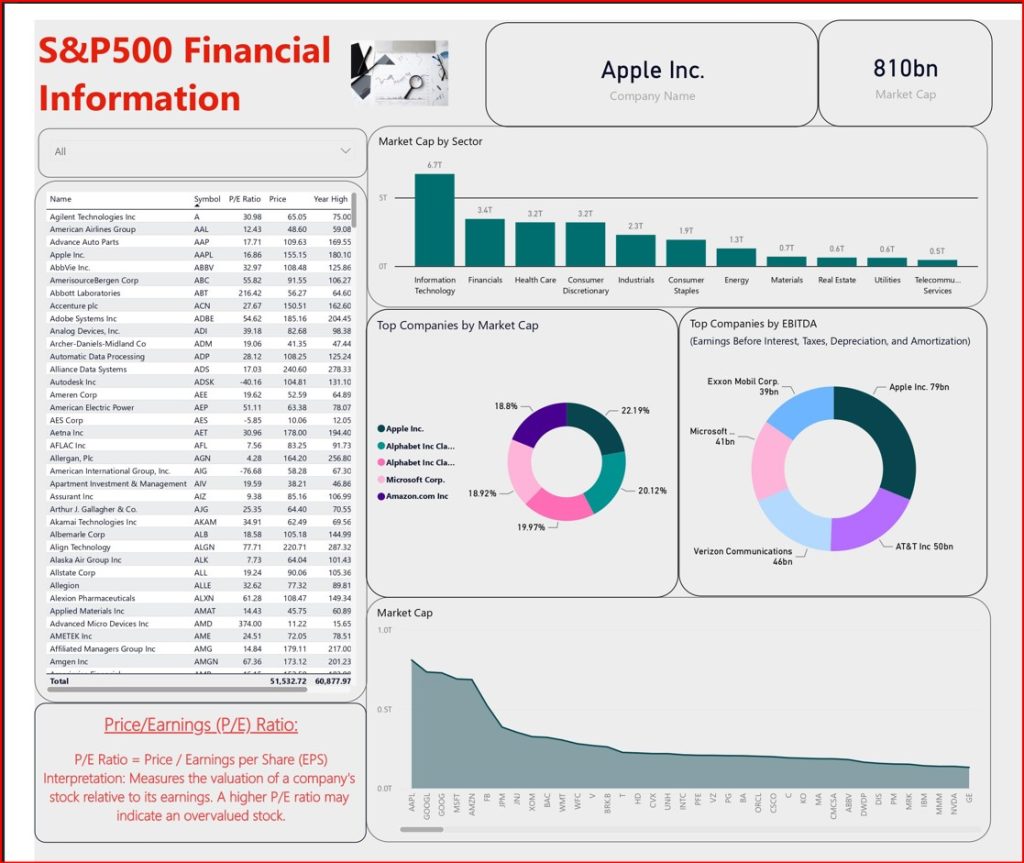
S&P 500 Companies Financial Information Analysis with Power BI
The S&P 500 dataset includes a list of companies in the S&P 500 (Standard and Poor’s 500) updated in the year 2020. The S&P 500 is a free-float, capitalization-weighted index of the top 500 publicly listed stocks in the US (top 500 by market cap). It includes a list of all the stocks contained therein and associated key financials such as price, market capitalization, earnings, price/earnings ratio, price to book, etc.
This dashboard was produced using Power BI, leveraging the capabilities of DAX (Data Analysis Expressions) and measures to gain deep insights and conduct a comprehensive analysis of S&P financial data, paving the way for informed decision-making.
Field Names and Meanings
1. Symbol: The stock ticker symbol or abbreviation that uniquely identifies a publicly traded company’s stock on the stock exchange. For example, “AAPL” represents Apple Inc., and “MSFT” represents Microsoft Corporation.
2. Price: The current trading price of the company’s stock in the stock market. This value can fluctuate throughout the trading day.
3. Price/Earnings (P/E): The Price-to-Earnings ratio, which is calculated by dividing the current stock price by the earnings per share (EPS). It’s a measure of a company’s valuation and represents how much investors are willing to pay for each dollar of earnings.
4. Dividend Yield: The dividend yield is the annual dividend payment made by the company to its shareholders divided by the stock’s current price. It represents the percentage return on investment from dividends.
5. Earnings per Share (EPS): The earnings per share is the portion of a company’s profit allocated to each outstanding share of its common stock. It’s a measure of a company’s profitability on a per-share basis.
6. Price/Sales (P/S): The Price-to-Sales ratio, calculated by dividing the current stock price by the company’s revenue per share. It helps evaluate a company’s valuation relative to its revenue.
7. Price/Book (P/B): The Price-to-Book ratio, calculated by dividing the current stock price by the company’s book value per share. It assesses whether a stock is undervalued or overvalued based on its accounting book value.
8. 52 Week High: The highest trading price that the stock has reached in the past 52 weeks (one year).
9. 52 Week Low: The lowest trading price that the stock has reached in the past 52 weeks (one year).
10. EBITDA (Earnings Before Interest, Taxes, Depreciation, and Amortization): EBITDA is a measure of a company’s operating performance. It represents earnings before considering non-operating income, interest expenses, taxes, and depreciation and amortization expenses.
This dataset provides valuable information for investors and analysts to assess the financial health, valuation, and performance of companies in the S&P 500 index. Each of these metrics can be used to analyze and compare different companies and make informed investment decisions.

Basic Insights
Apple Inc. is the most profitable company with a Market cap of 810 Billion US Dollars.
The Information Technology Industry continues to thrive, highlighting the fast-paced swing of today’s innovations accumulating 6.7 Trillion Dollars in the total market cap with some leading companies.
Technip FMC, a company in the Energy sector has a Price/Earning Ratio at Infinity. It is important to understand why and determine why their stock is overvalued.
With only 2 companies (Apple Inc. and Microsoft) being among the Top 5 companies by Market Cap and EBITDA. It is crucial to understand the factors that affect company valuations and the limitations associated.