
Product Sales Analysis Using SQL
In this project, I utilized SQL to analyze sample sales data. This product sales data was downloaded from Kaggle and contains information related to sales orders, order details, customer information, shipping details, and more. This data can be used for various purposes, such as segmentation, customer analytics, clustering, and sales simulation training.
At the time of this analysis, this sales data recorded its sales transaction data from January 2003 to May 2005. The entire dataset can be accessed through this link.
Objective
The goal of this analysis is to achieve several business objectives, including addressing inquiries about sales performance, extracting valuable insights, and formulating recommendations to enhance revenue. The primary focus is on orders that have been shipped or are currently in progress.
1. REVENUE BY YEARLY SALES
- Get the revenue by multiplying “priceeach” (Sales price) by “quantityordered” (Number of items sold).
- Use the DISTINCT function to extract unique quarters from “Qtr_id”, year from “year_id” and “customername” with alias Customers


RESULT:
- The years 2003 and 2004 have 4 quarters while 2005 has just 2 quarters (incomplete).
- 64 customers in 2004 generated a revenue of over three million showing an increase in customers and revenue from the previous year 2003.
2. COUNTRY WITH MOST AND LEAST REVENUE
- Select the country of purchase, count DISTINCT orders, and get the sum of product purchased alias revenue.
- Using the status of purchases that are successful or in process.


RESULT:
- USA had the most customer purchases, generating the most revenue for the company.
- Ireland and Switzerland had the least customer purchases with Ireland generating the least revenue.
3. HIGHEST AND LOWEST SELLING PRODUCTS
- Select product, revenue as total_sales and the sum of quantity purchased as quantity
- Select in both ascending and descending order to know the best and worst performing product.

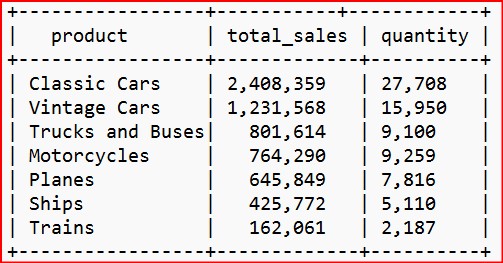
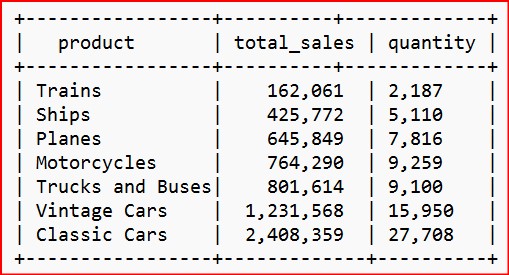
RESULTS:
- Classic Cars are the most lucrative product category having the most sales and generating the most revenue.
- Trains had the least sales in the product category.
4. PRODUCTS PENDING, CANCELLED AND RETURNED
- Select products that are canceled, disputed, or pending to check which product is most affected.

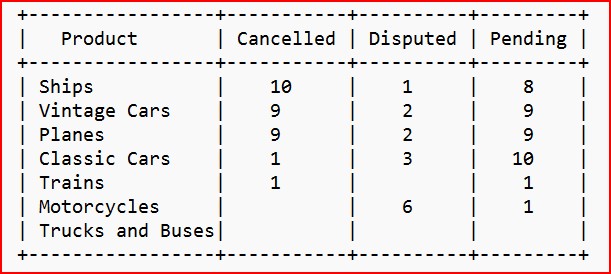
RESULT:
- Ships, Vintage Cars, and Planes have the most canceled or pending orders which would affect revenue from the product sales.
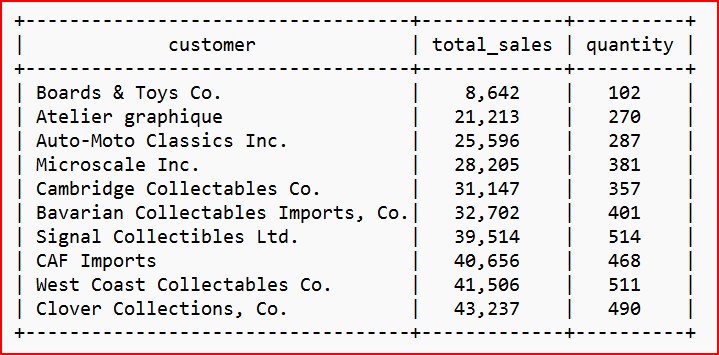
5. MOST AND LEAST SALES BY CUSTOMERS
- Select customer, calculate revenue as total_sales and sum of the quantity purchased as quantity.
- Limit this to just the top 10 in ascending order

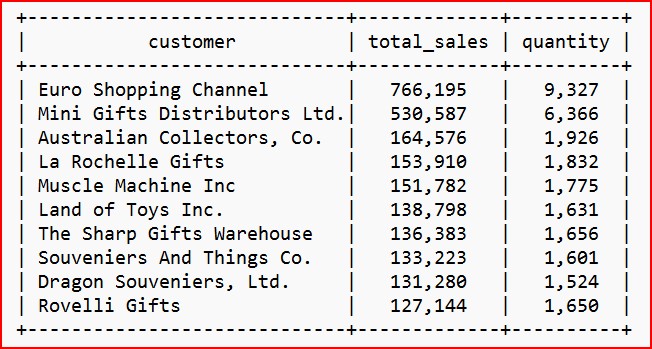
RESULTS:
- The Euro Shopping Channel was the most valuable customer having the most purchases
- Beards and Toys was the least valuable customer.
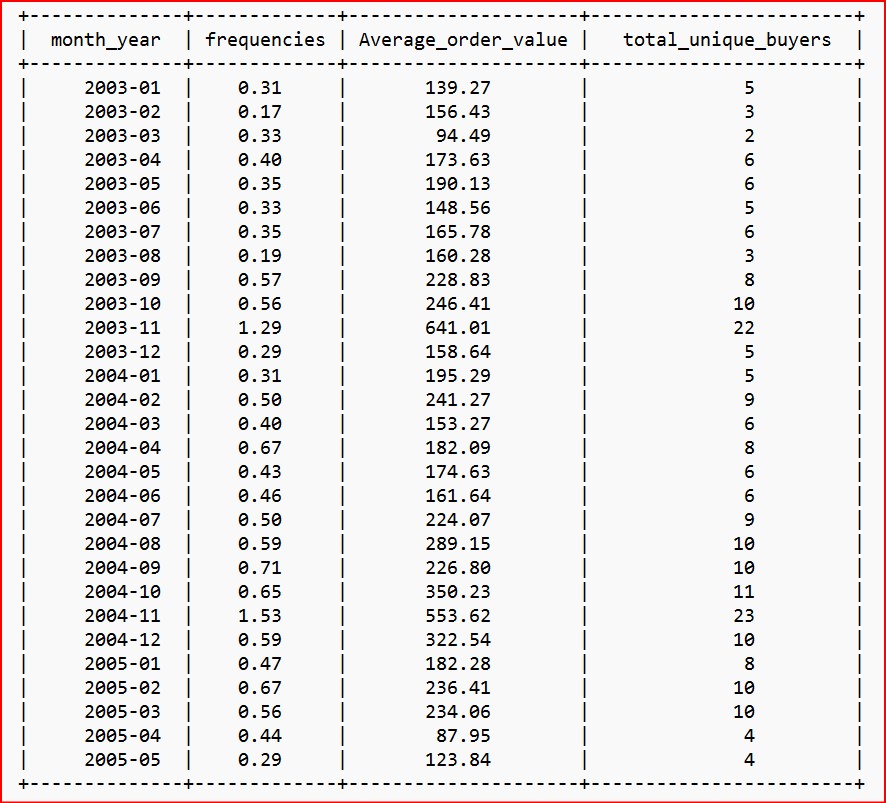
6. CREATE A QUERY FOR FREQUENCIES, AVERAGE ORDER VALUE, AND THE TOTAL NUMBER OF UNIQUE BUYERS FOR SHIPPED PRODUCTS
- Join the month and year columns using “CONCAT” in a year-month format
- Calculate the ratio of the count of unique order_number to the count of unique ORDERLINENUMBER, round the result to two decimal places, and assign the alias frequencies.
- Calculate the average order value by dividing the sum of PRICEEACH each by the count of unique QUANTITYORDERED, rounding the result to two decimal places, and assigning it the alias Average_order_value.
N/B: T_U_B = TOTAL UNIQUE BUYERS

RECOMMENDATIONS
- Improve Location Based Purchases: With most customers coming from the United States, it is important to improve customer purchases from other low-performing countries by understanding why customers are high from the United States and applying that to others.
- Build Sustainable Partnerships with Most Valuable Customers: Create collaborative partnerships with customers that exhibit outstanding sales and boost high revenue. Through these customer retention alliances, we can secure favorable terms, enhance profitability, and drive further promotional initiatives to boost sales.
- Limit Incomplete Orders: With some products generating high revenue, some products have a high number of incomplete orders (pending and canceled) thus affecting the sales and revenue. It is essential to determine why and find a solution.